Most of Burnsville's housing was built between the 1960s and the 1990s, and its neighbors are mostly younger. The Census Bureau's figures below show when, and how much of the housing is owner occupied. Reuse them with a credit to the Census Bureau and a link here.
We are a lead referral service, not a contractor. Free, no-obligation quotes.
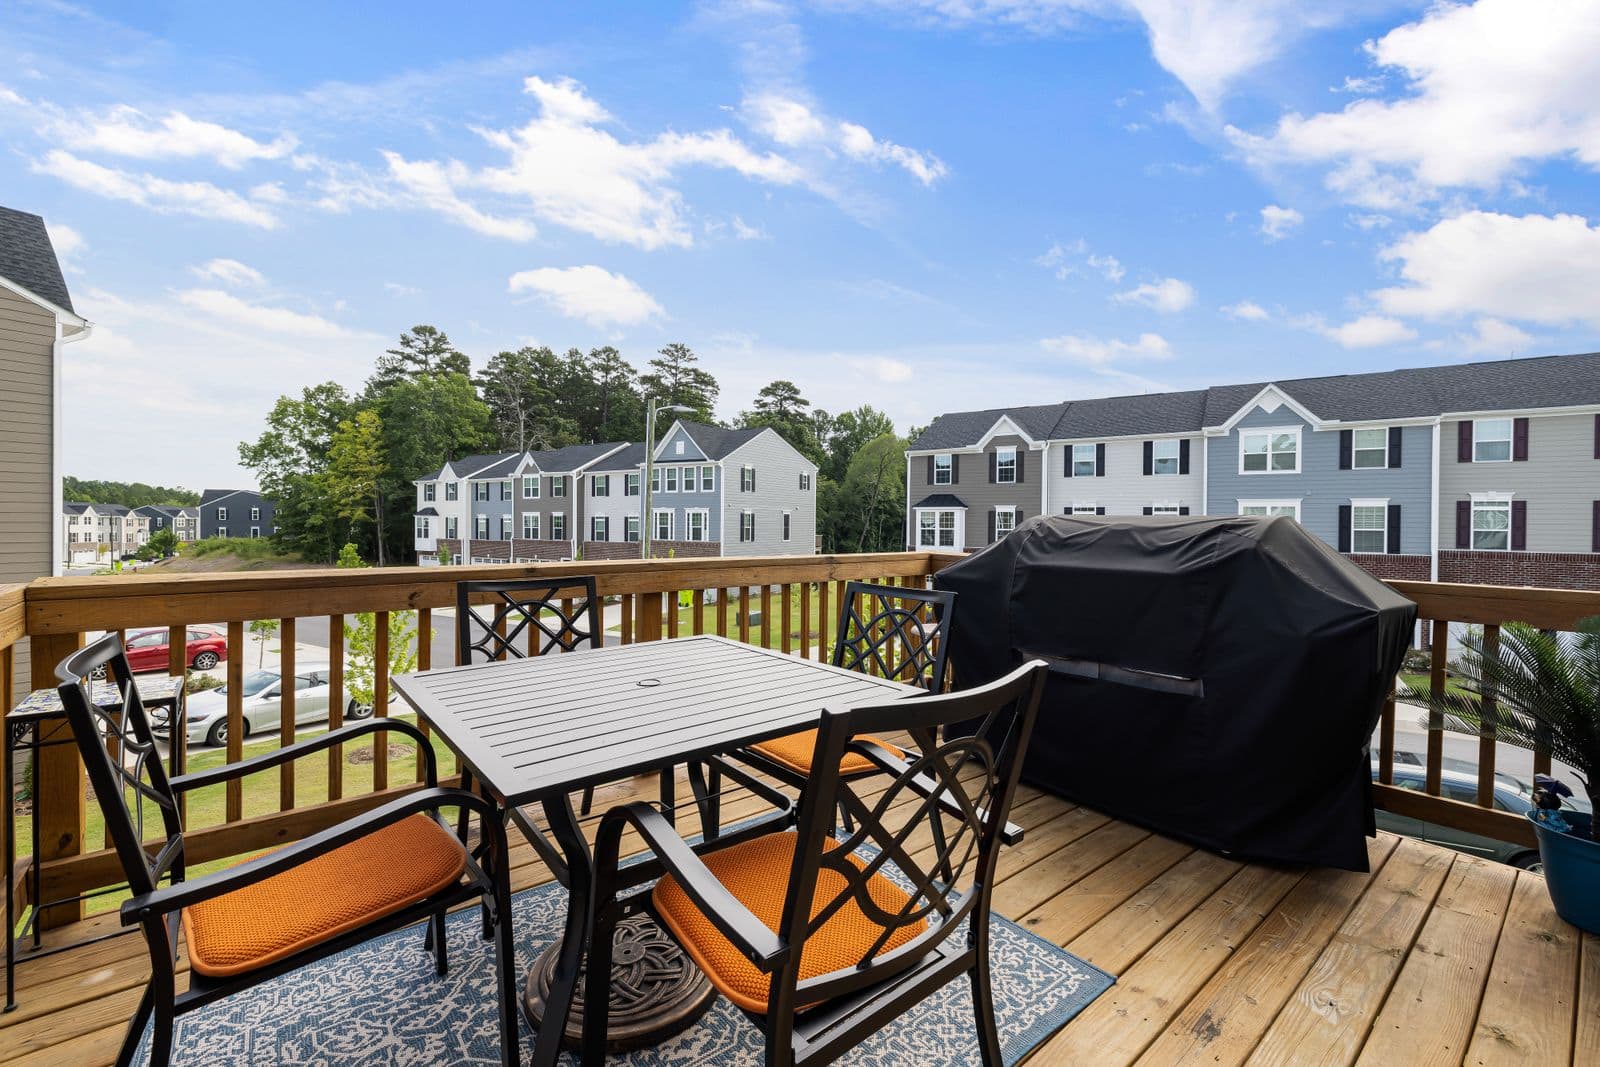
Burnsville has the oldest housing of the places here: its median home was built in 1982, and 45 percent of its homes before 1980. The newest is Rosemount, with a median year built of 2000.
| Place | Median year built | Before 1960 | 1960 to 1979 | 1980 to 1999 | 2000 or later |
|---|---|---|---|---|---|
| Burnsville | 1982 | 7% | 38% | 42% | 13% |
| Apple Valley | 1990 | 3% | 27% | 44% | 26% |
| Lakeville | 1999 | 4% | 11% | 37% | 48% |
| Eagan | 1988 | 3% | 22% | 56% | 19% |
| Savage | 1997 | 4% | 8% | 48% | 40% |
| Rosemount | 2000 | 8% | 9% | 34% | 50% |
Owner occupancy runs from 65 percent in Burnsville to 88 percent in Lakeville.
| Place | Homes | Owner occupied | Detached houses |
|---|---|---|---|
| Burnsville | 26,545 | 65% | 45% |
| Apple Valley | 22,013 | 73% | 51% |
| Lakeville | 26,315 | 88% | 72% |
| Eagan | 28,789 | 68% | 50% |
| Savage | 12,207 | 86% | 70% |
| Rosemount | 10,175 | 87% | 68% |
Data: Census Bureau, American Community Survey, 2020 to 2024 five-year estimates, tables B25034, B25035, B25003 and B25024. These are sample estimates with margins of error.
Rounded shares of housing units; owner occupied is a share of occupied units. Savage sits in Scott County; the rest are in Dakota County.
Send a few words about the project, and a licensed deck builder working in Burnsville will get in touch to see the site. A deck quote depends on the yard and the house, so it comes after the visit.